> ## Documentation Index
> Fetch the complete documentation index at: https://omni.fireflo.au/llms.txt
> Use this file to discover all available pages before exploring further.
# Analytics
> Ready-made reports on everything OMNI does, reports you build yourself by picking fields, and exporting them as CSV or Excel.
Analytics puts OMNI's figures in one place: messages, conversations, contacts, broadcasts
and spend, and calls, tickets, deals, AI agents and the OMNI API when your account has
them. Open a **built-in report**, or **build your own** by choosing what to count and how
to group it — no formulas, no queries. Any report can be exported, shared with your team,
or [sent on a schedule](/analytics/schedules).
**Analytics needs nothing in your plan:** every account has it. Its **Analytics** entry
appears in the menu once a channel is on, and opens onto **Reports**, **New report** and
**Schedules**.
 ## The report library
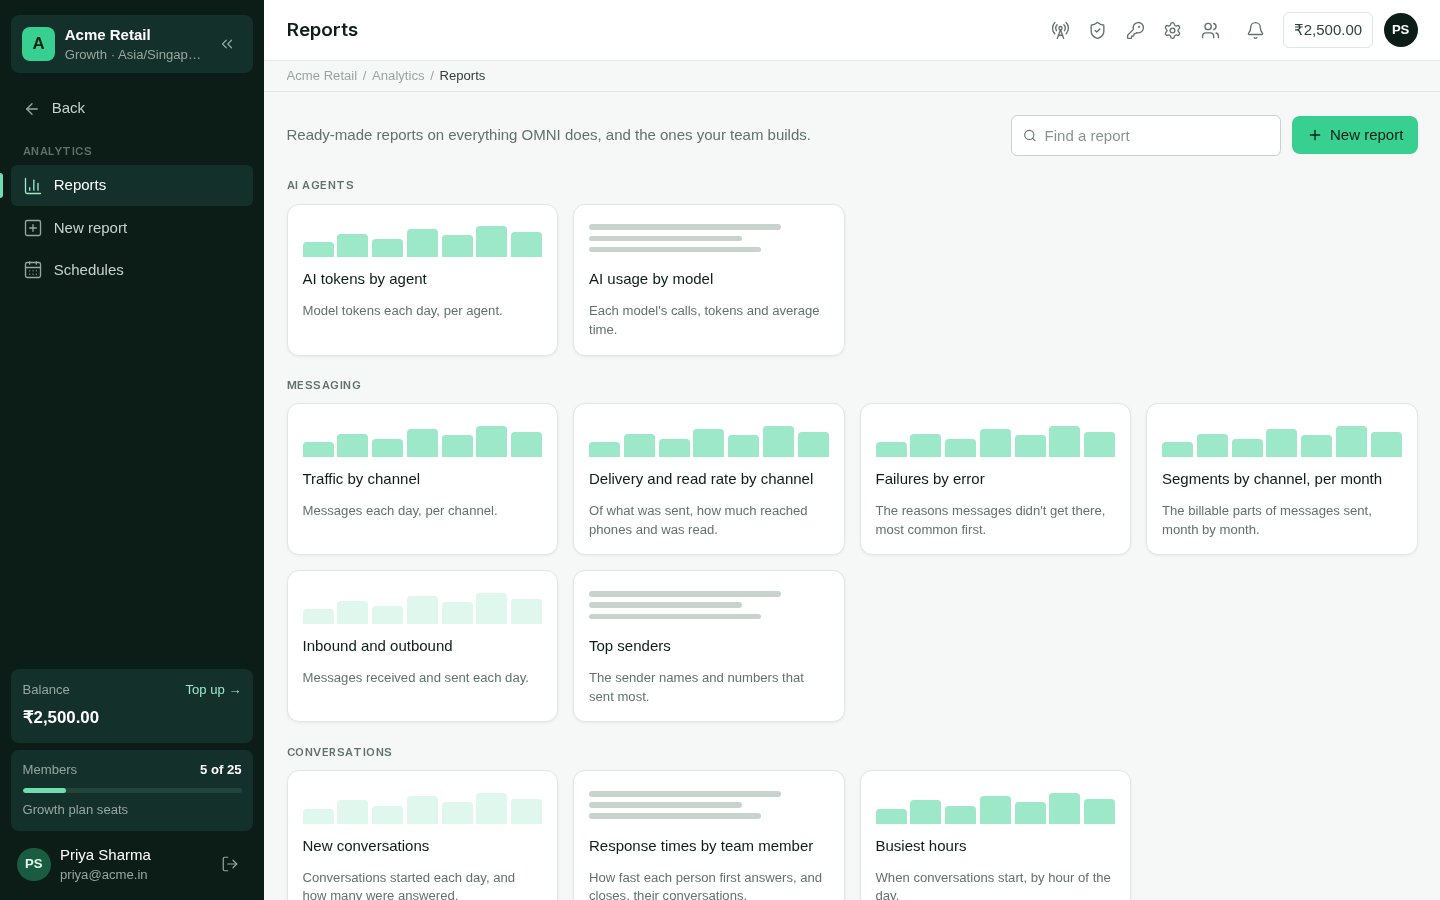
**Analytics → Reports** lists:
* **Your team's reports** — the ones saved and shared with everyone, and your own. Pinned
reports come first.
* **The built-in reports**, by category.
Search finds a report by its name, description or category. A category appears only when
your account has what it reports on, and you may see that data elsewhere in the panel —
**Spend** needs permission to see transactions, **Calls** permission to see the call log,
and so on.
| Category | Built-in reports |
| :- | :- |
| Messaging | Traffic by channel · Delivery and read rate by channel · Failures by error · Segments by channel, per month · Inbound and outbound · Top senders |
| Conversations | New conversations · Response times by team member · Busiest hours |
| Contacts | Contact growth · Opt-outs by how they asked |
| Broadcasts | Broadcast comparison · Broadcasts per month by channel |
| Spend | Spend per month · Top-ups and usage |
| Calls (with Voice) | Calls answered and missed · Calls by IVR · Voice agent calls · Busiest calling hours |
| Tickets (with [Tickets](/batteries/tickets)) | Tickets opened and solved · Ticket times by team member · Tickets by category · Solved by AI and by people |
| Pipeline (with [Pipelines](/batteries/pipelines)) | Deals won and lost by month · Open deals by stage · Deals from broadcasts |
| AI agents (with [AI Agents](/batteries/ai-agents)) | AI tokens by agent · AI usage by model |
| OMNI API (with the [OMNI API](/developers/overview)) | Where API messages got through · Why failover steps were refused · API requests and errors |
## Reading a report
* **Period.** Choose Today, Yesterday, the last 7, 30 or 90 days, this or last week, this
or last month, this year, the last 12 months — or **Custom dates**, up to 800 days.
Days are your account's, in its time zone: a message sent at 1:30 am counts on that
day, wherever the server is.
* **Compare with the previous period** adds the period just before, of the same length.
Each total then shows its change — a rate's change in percentage points ("−1.2 pts").
* **Totals**, one per measure, for the whole period.
* **The chart** — line, bar, stacked bars, area or pie. Switch it with the chips above
it; the switch doesn't change the saved report.
* **The table**, with a totals row. A report grouped by something other than time shows
its top rows (50 unless the report says otherwise) and adds up the rest as **Other**.
At most 10,000 rows are counted; past that, the report says so — narrow the period or
add a filter.
Built-in reports can't be changed: **Edit a copy** opens the copy in the designer. On
your own reports, and on shared ones if you may build reports, **Edit**, **Pin** and
**Delete** are there too.
### Exporting
**CSV** and **Excel** save the report, for the period on screen, to
[Downloads](/using/downloads). Figures are written as people read them: rates as
percentages, money in whole units of your currency, durations in seconds. The Excel file
has the report's name and period at the top and a bold totals row.
## Building a report
**Analytics → New report** builds one in seven steps. The preview on the right redraws as
you choose, with your real figures.
## The report library
**Analytics → Reports** lists:
* **Your team's reports** — the ones saved and shared with everyone, and your own. Pinned
reports come first.
* **The built-in reports**, by category.
Search finds a report by its name, description or category. A category appears only when
your account has what it reports on, and you may see that data elsewhere in the panel —
**Spend** needs permission to see transactions, **Calls** permission to see the call log,
and so on.
| Category | Built-in reports |
| :- | :- |
| Messaging | Traffic by channel · Delivery and read rate by channel · Failures by error · Segments by channel, per month · Inbound and outbound · Top senders |
| Conversations | New conversations · Response times by team member · Busiest hours |
| Contacts | Contact growth · Opt-outs by how they asked |
| Broadcasts | Broadcast comparison · Broadcasts per month by channel |
| Spend | Spend per month · Top-ups and usage |
| Calls (with Voice) | Calls answered and missed · Calls by IVR · Voice agent calls · Busiest calling hours |
| Tickets (with [Tickets](/batteries/tickets)) | Tickets opened and solved · Ticket times by team member · Tickets by category · Solved by AI and by people |
| Pipeline (with [Pipelines](/batteries/pipelines)) | Deals won and lost by month · Open deals by stage · Deals from broadcasts |
| AI agents (with [AI Agents](/batteries/ai-agents)) | AI tokens by agent · AI usage by model |
| OMNI API (with the [OMNI API](/developers/overview)) | Where API messages got through · Why failover steps were refused · API requests and errors |
## Reading a report
* **Period.** Choose Today, Yesterday, the last 7, 30 or 90 days, this or last week, this
or last month, this year, the last 12 months — or **Custom dates**, up to 800 days.
Days are your account's, in its time zone: a message sent at 1:30 am counts on that
day, wherever the server is.
* **Compare with the previous period** adds the period just before, of the same length.
Each total then shows its change — a rate's change in percentage points ("−1.2 pts").
* **Totals**, one per measure, for the whole period.
* **The chart** — line, bar, stacked bars, area or pie. Switch it with the chips above
it; the switch doesn't change the saved report.
* **The table**, with a totals row. A report grouped by something other than time shows
its top rows (50 unless the report says otherwise) and adds up the rest as **Other**.
At most 10,000 rows are counted; past that, the report says so — narrow the period or
add a filter.
Built-in reports can't be changed: **Edit a copy** opens the copy in the designer. On
your own reports, and on shared ones if you may build reports, **Edit**, **Pin** and
**Delete** are there too.
### Exporting
**CSV** and **Excel** save the report, for the period on screen, to
[Downloads](/using/downloads). Figures are written as people read them: rates as
percentages, money in whole units of your currency, durations in seconds. The Excel file
has the report's name and period at the top and a bold totals row.
## Building a report
**Analytics → New report** builds one in seven steps. The preview on the right redraws as
you choose, with your real figures.
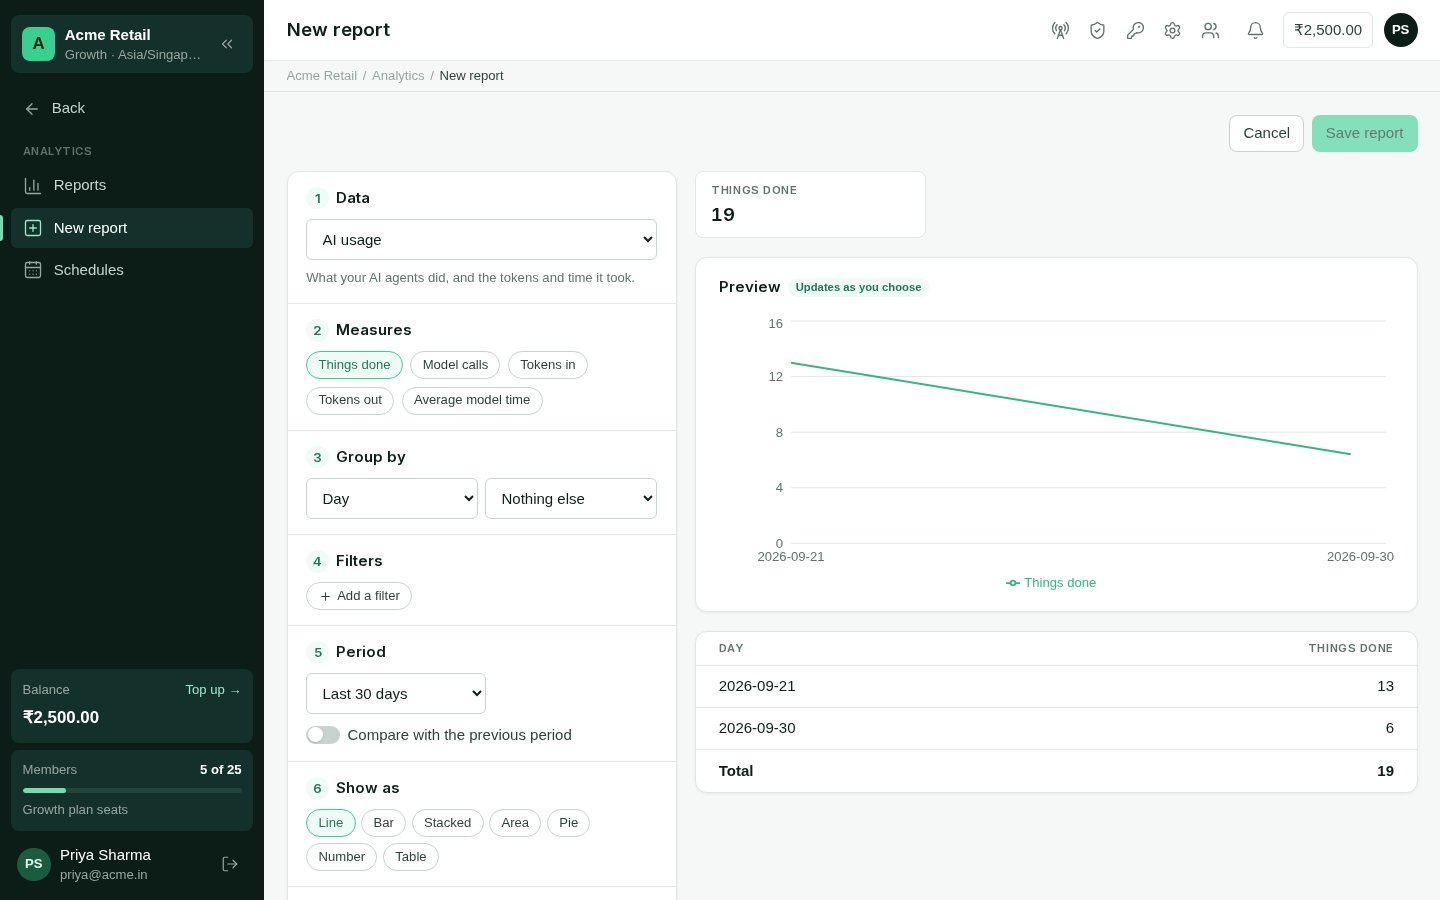 What the report is about. Each source counts one kind of thing — see the table below.
What to count, up to six: messages, delivered, delivery rate, average first response…
Up to two things: a time — day, week, month, hour of day or day of week (one time at
most) — and anything the source offers, such as channel, status or team member. With
nothing chosen, the report is a single figure per measure. Grouped by something other
than time, choose how many rows to show; the rest are added up as Other.
Up to ten: keep or leave out values of a field. The values offered are the ones your
data holds, the most common first.
The period the report opens on, and whether it compares with the period before.
Line, bar, stacked, area, pie, a single number, or a table.
A name, an optional description, and who sees it: **Everyone in the account**, or
**Only me**.
### What each source counts
| Source | Measures | Group and filter by |
| :- | :- | :- |
| **Messages** | Messages, sent, delivered, read, failed, segments, delivery rate, read rate, failure rate | Channel, direction, status, error, sender, broadcast, kind, sent by |
| **Conversations** | Conversations, open, closed, answered, average first response, average time to close, answered share | State, assigned to, priority |
| **Contacts** | Contacts added, opted out since, do not contact | Segment |
| **Opt-outs** | Opt-outs, by when they asked | How they opted out, segment |
| **Broadcasts** | Broadcasts, recipients, delivered, failed, left out (opted out), delivery rate | Broadcast, channel, status |
| **Spend** | Spent, topped up, entries | Kind, description (group only) |
| **Calls** | Calls, answered, not answered or missed, talk time, average call, answer rate | Kind, direction, status, IVR, voice agent, placed by, your number, how it ended |
| **Tickets** | Tickets, solved, still open, solved by AI, average first response, average time to solve, solved share, solved by AI of those solved | Status, priority, category, assigned to, how it started, handled by, solved by |
| **Deals** | Deals, won, lost, closed, value, value won, win rate, average time to close | Pipeline, stage, status, from broadcast |
| **AI usage** | Things done, model calls, tokens in, tokens out, average model time | Agent, model, AI provider, what happened |
| **Messages with failover** | Messages, succeeded, failed, success rate, average time to finish | Status, got there on, how far it got, why it failed, template, purpose |
| **Failover steps** | Steps tried, got there, refused, timed out, got there of those tried | Channel, step, ended, why it was refused |
| **API requests** | Requests, errors, error rate, average time | Method, answer, error, API key, from (your systems or the playground) |
A few things to know:
* **Delivery rate** is delivered (or read, or replied to) out of those sent; **read rate**
is read out of those delivered.
* **First response** is the time from a conversation's start to the first answer from
your team or an AI agent.
* **Money** is shown in your account's currency. Spend comes from your balance's
transactions, so it has no per-channel split. Calls and AI usage report time and
tokens, not money.
* **Message figures for past days** are counted once a day and settle after two days, as
late delivery reports arrive; today's are counted live.
## Who may
| To | Permission | Roles by default |
| :- | :- | :- |
| See reports, change their period, compare | See analytics reports | Owner, Admin, Support, Viewer |
| Build, change, share and export reports | Build, change, share and export analytics reports | Owner, Admin, Support |
| Schedule reports and choose where they go | Schedule reports and choose where they are sent | Owner, Admin |
On top of these, each source needs the permission that shows that data elsewhere — the
message log for Messages, transactions for Spend, tickets for Tickets — so a report never
shows someone what the rest of the panel would hide.
This documentation is built and hosted on [Mintlify](https://mintlify.com), a developer documentation platform.
What the report is about. Each source counts one kind of thing — see the table below.
What to count, up to six: messages, delivered, delivery rate, average first response…
Up to two things: a time — day, week, month, hour of day or day of week (one time at
most) — and anything the source offers, such as channel, status or team member. With
nothing chosen, the report is a single figure per measure. Grouped by something other
than time, choose how many rows to show; the rest are added up as Other.
Up to ten: keep or leave out values of a field. The values offered are the ones your
data holds, the most common first.
The period the report opens on, and whether it compares with the period before.
Line, bar, stacked, area, pie, a single number, or a table.
A name, an optional description, and who sees it: **Everyone in the account**, or
**Only me**.
### What each source counts
| Source | Measures | Group and filter by |
| :- | :- | :- |
| **Messages** | Messages, sent, delivered, read, failed, segments, delivery rate, read rate, failure rate | Channel, direction, status, error, sender, broadcast, kind, sent by |
| **Conversations** | Conversations, open, closed, answered, average first response, average time to close, answered share | State, assigned to, priority |
| **Contacts** | Contacts added, opted out since, do not contact | Segment |
| **Opt-outs** | Opt-outs, by when they asked | How they opted out, segment |
| **Broadcasts** | Broadcasts, recipients, delivered, failed, left out (opted out), delivery rate | Broadcast, channel, status |
| **Spend** | Spent, topped up, entries | Kind, description (group only) |
| **Calls** | Calls, answered, not answered or missed, talk time, average call, answer rate | Kind, direction, status, IVR, voice agent, placed by, your number, how it ended |
| **Tickets** | Tickets, solved, still open, solved by AI, average first response, average time to solve, solved share, solved by AI of those solved | Status, priority, category, assigned to, how it started, handled by, solved by |
| **Deals** | Deals, won, lost, closed, value, value won, win rate, average time to close | Pipeline, stage, status, from broadcast |
| **AI usage** | Things done, model calls, tokens in, tokens out, average model time | Agent, model, AI provider, what happened |
| **Messages with failover** | Messages, succeeded, failed, success rate, average time to finish | Status, got there on, how far it got, why it failed, template, purpose |
| **Failover steps** | Steps tried, got there, refused, timed out, got there of those tried | Channel, step, ended, why it was refused |
| **API requests** | Requests, errors, error rate, average time | Method, answer, error, API key, from (your systems or the playground) |
A few things to know:
* **Delivery rate** is delivered (or read, or replied to) out of those sent; **read rate**
is read out of those delivered.
* **First response** is the time from a conversation's start to the first answer from
your team or an AI agent.
* **Money** is shown in your account's currency. Spend comes from your balance's
transactions, so it has no per-channel split. Calls and AI usage report time and
tokens, not money.
* **Message figures for past days** are counted once a day and settle after two days, as
late delivery reports arrive; today's are counted live.
## Who may
| To | Permission | Roles by default |
| :- | :- | :- |
| See reports, change their period, compare | See analytics reports | Owner, Admin, Support, Viewer |
| Build, change, share and export reports | Build, change, share and export analytics reports | Owner, Admin, Support |
| Schedule reports and choose where they go | Schedule reports and choose where they are sent | Owner, Admin |
On top of these, each source needs the permission that shows that data elsewhere — the
message log for Messages, transactions for Spend, tickets for Tickets — so a report never
shows someone what the rest of the panel would hide.
This documentation is built and hosted on [Mintlify](https://mintlify.com), a developer documentation platform.