
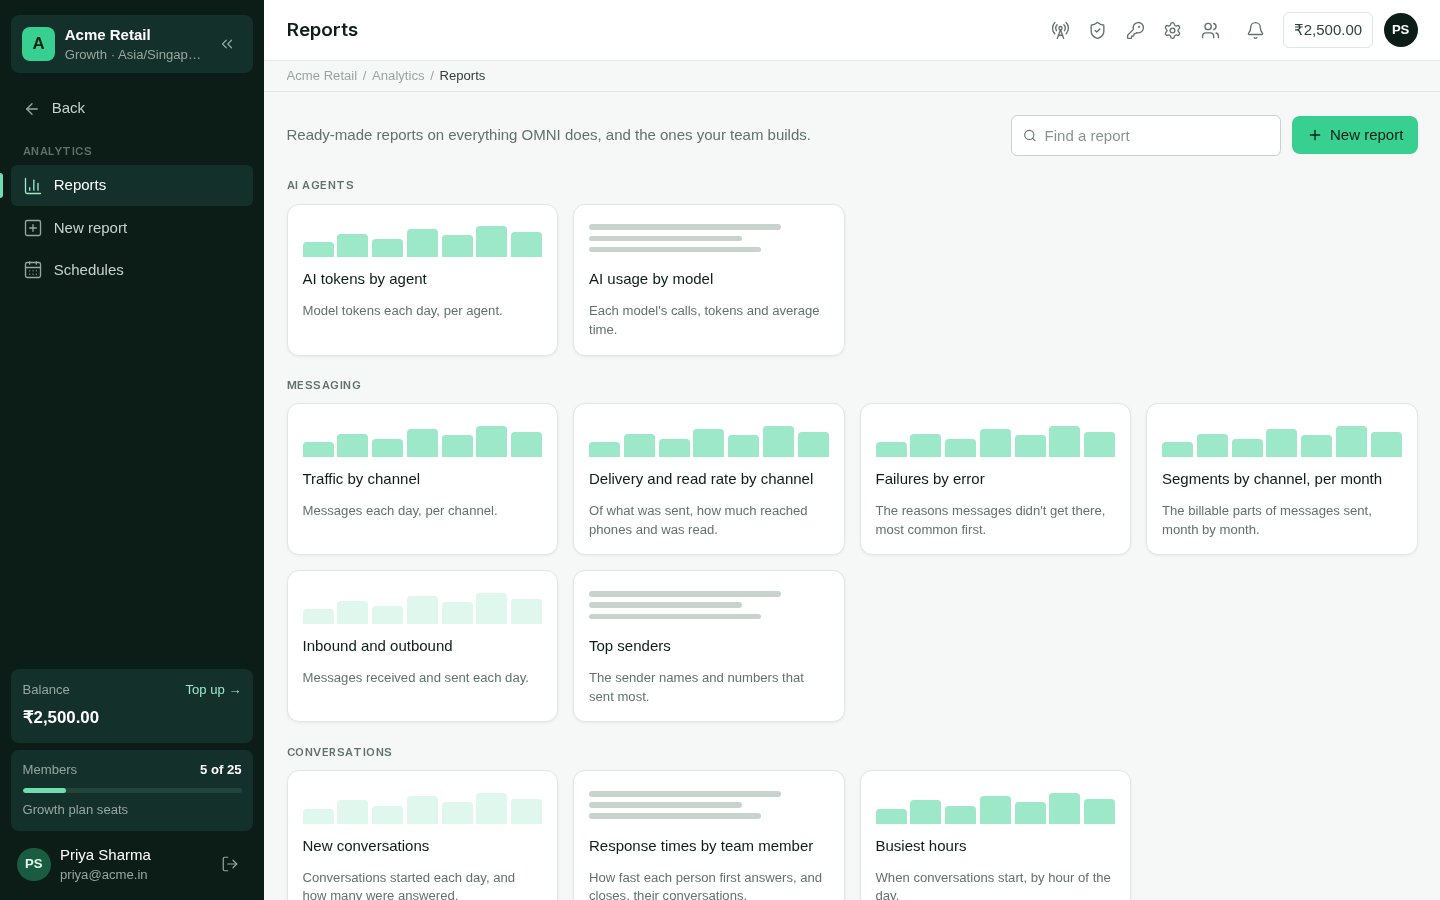
Reports: your team's reports first, then the built-in ones by category.
The report library
Analytics → Reports lists:- Your team’s reports — the ones saved and shared with everyone, and your own. Pinned reports come first.
- The built-in reports, by category.
Reading a report
- Period. Choose Today, Yesterday, the last 7, 30 or 90 days, this or last week, this or last month, this year, the last 12 months — or Custom dates, up to 800 days. Days are your account’s, in its time zone: a message sent at 1:30 am counts on that day, wherever the server is.
- Compare with the previous period adds the period just before, of the same length. Each total then shows its change — a rate’s change in percentage points (“−1.2 pts”).
- Totals, one per measure, for the whole period.
- The chart — line, bar, stacked bars, area or pie. Switch it with the chips above it; the switch doesn’t change the saved report.
- The table, with a totals row. A report grouped by something other than time shows its top rows (50 unless the report says otherwise) and adds up the rest as Other. At most 10,000 rows are counted; past that, the report says so — narrow the period or add a filter.
Exporting
CSV and Excel save the report, for the period on screen, to Downloads. Figures are written as people read them: rates as percentages, money in whole units of your currency, durations in seconds. The Excel file has the report’s name and period at the top and a bold totals row.Building a report
Analytics → New report builds one in seven steps. The preview on the right redraws as you choose, with your real figures.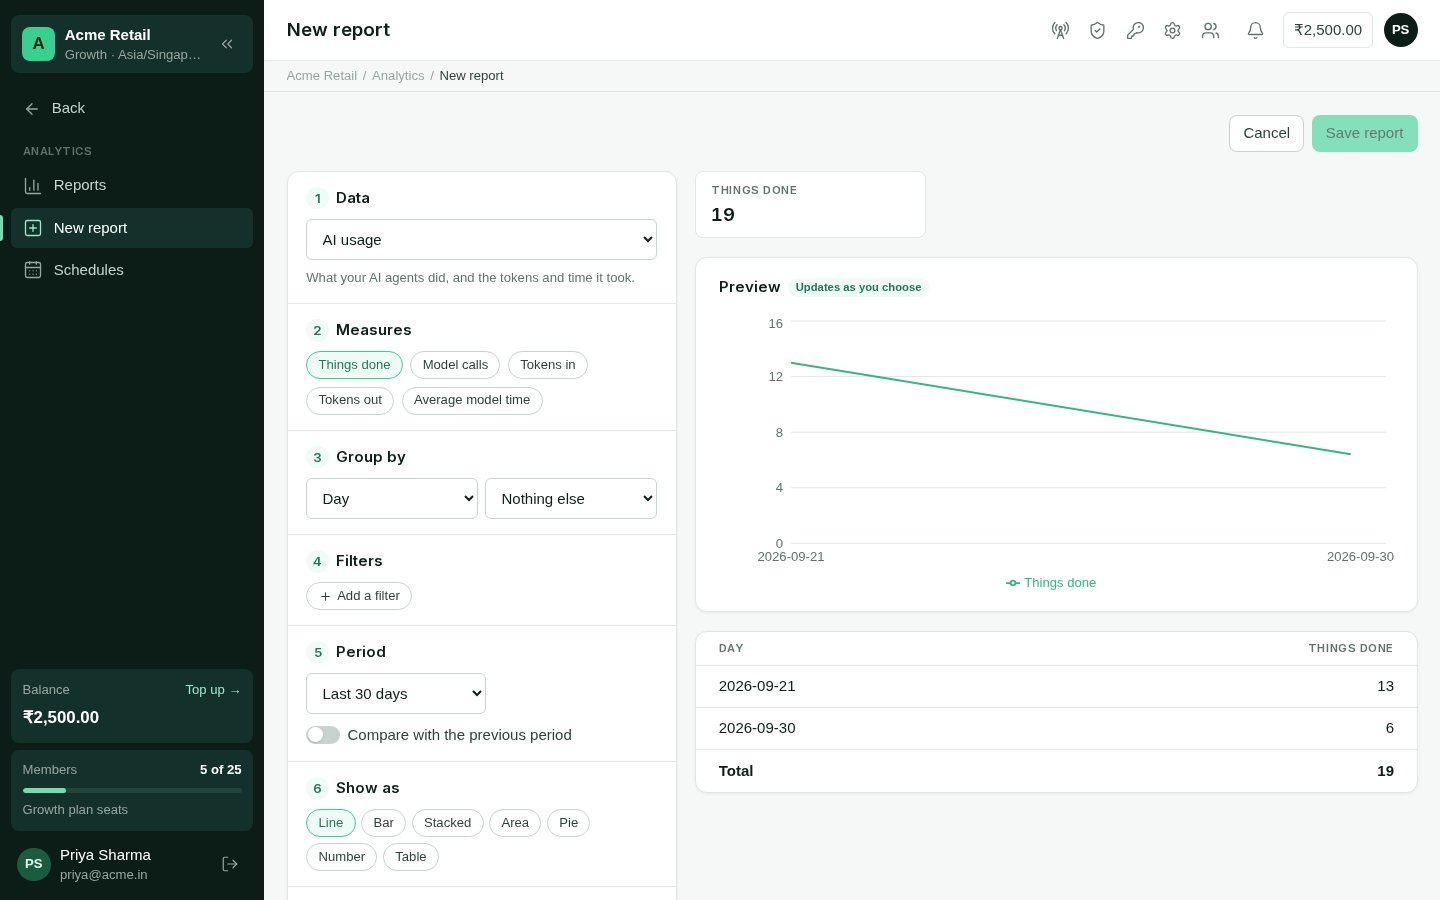
New report: the steps on the left, the live preview on the right.
1
Data
What the report is about. Each source counts one kind of thing — see the table below.
2
Measures
What to count, up to six: messages, delivered, delivery rate, average first response…
3
Group by
Up to two things: a time — day, week, month, hour of day or day of week (one time at
most) — and anything the source offers, such as channel, status or team member. With
nothing chosen, the report is a single figure per measure. Grouped by something other
than time, choose how many rows to show; the rest are added up as Other.
4
Filters
Up to ten: keep or leave out values of a field. The values offered are the ones your
data holds, the most common first.
5
Period
The period the report opens on, and whether it compares with the period before.
6
Show as
Line, bar, stacked, area, pie, a single number, or a table.
7
Name and sharing
A name, an optional description, and who sees it: Everyone in the account, or
Only me.
What each source counts
A few things to know:
- Delivery rate is delivered (or read, or replied to) out of those sent; read rate is read out of those delivered.
- First response is the time from a conversation’s start to the first answer from your team or an AI agent.
- Money is shown in your account’s currency. Spend comes from your balance’s transactions, so it has no per-channel split. Calls and AI usage report time and tokens, not money.
- Message figures for past days are counted once a day and settle after two days, as late delivery reports arrive; today’s are counted live.
Who may
On top of these, each source needs the permission that shows that data elsewhere — the
message log for Messages, transactions for Spend, tickets for Tickets — so a report never
shows someone what the rest of the panel would hide.